Are Uniform Logos Catching the Eyes of Fans?

Since the introduction of sponsor logos on player uniforms in major U.S. pro sports, we’ve seen dozens of 7-figure deals and even some in the 8-figure range. With several years of activation available to analyze, Navigate decided to take a look at how these logos actually perform from a visual attention perspective. With some help from 3M’s Visual Attention Software (3M VAS), we took a deeper look at patches in 3 different sports.
3M VAS
3M VAS uses human-vision AI to analyze images and provide insights on gaze sequence, likelihood an area is seen within 3-5 seconds, hotspots that will draw the most attention, and more. We can then highlight patches and other signage as areas of interest to conduct a deeper analysis, which ultimately allows us to compare their effectiveness.
Patch Analyses
NHL
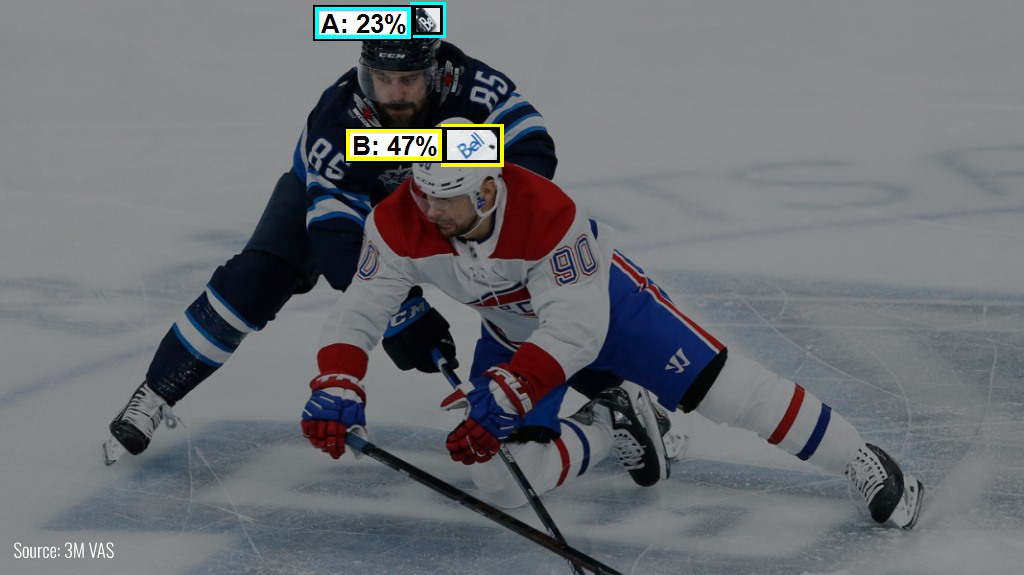
Starting with the newest addition, we’ll take a look at the helmet logo in the NHL. In a standard view of a broadcast, traditional signage such as dasher boards will have a wide range of outcomes dependent on where the puck is, where the majority of the players are, and if there are any obstructions to the view. Based on our analysis, the probability range that a viewer will see one of these logos in the first 3-5 seconds is about 26-72%. Using the image below, we can see that the main Bell logo has an isolated visibility of 47% which falls just about in the middle of the range for the dasher boards.
With similar visibility likelihood to traditional signage, in addition to the premium associated with being placed on an athlete’s uniform, we expect the helmet location to continue to be a premier asset for NHL teams.
MLS
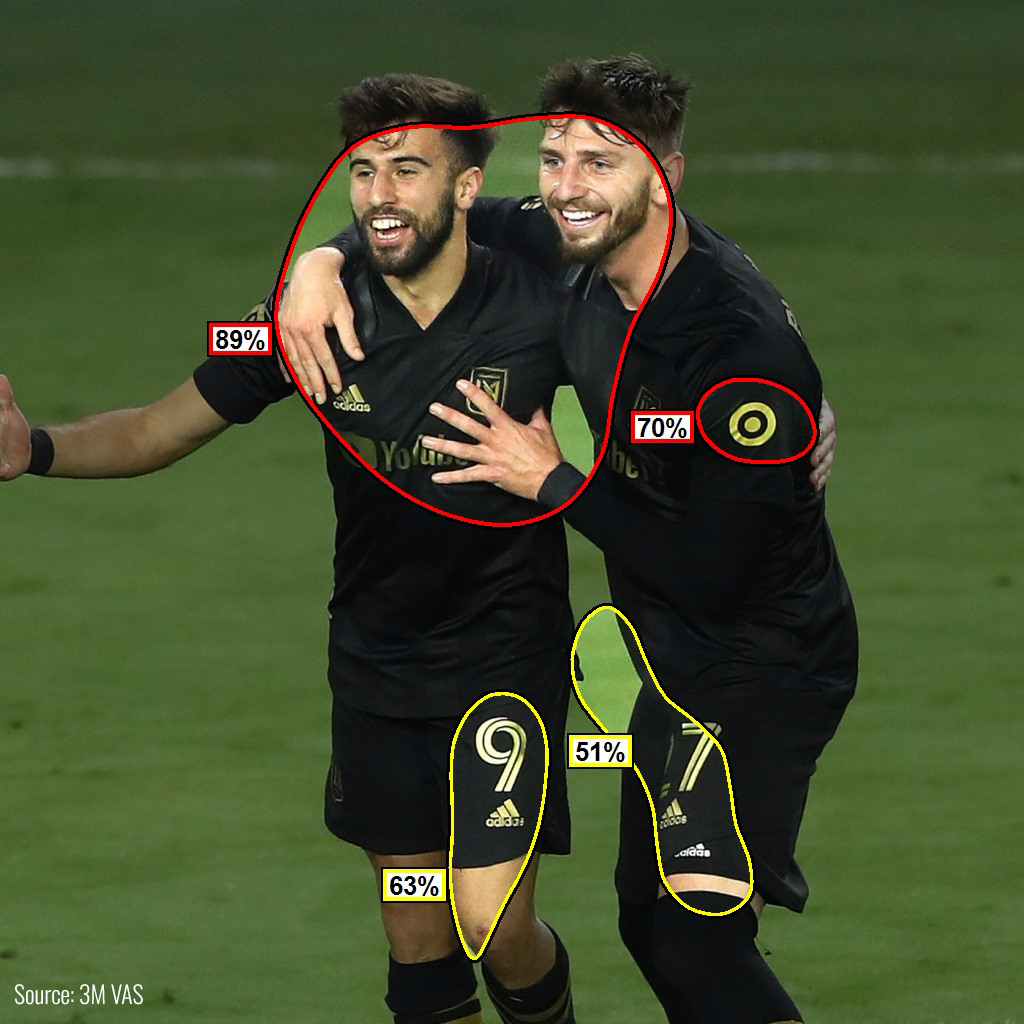
While the MLS sleeve patch program is still relatively young, they’ve obviously had sponsor logos on the chest for much longer. The chest location and size of the main logo make it the clear premier asset, but looking at the example below we also confirmed that with the right logo and contrast, the sleeve logo can also prove to be a very effective placement. In this alternate view, 3M VAS shows us the hotspots based on likelihood to be seen by the viewer. It is common for athletes’ faces to draw major attention, but in this example we also see a single hotspot for the sleeve logo with isolated visibility of 70%.
Clutter is a factor that we consider when we value assets at Navigate, but we can conclude from this image that having a chest and sleeve location should not diminish value as both assets can be effective tools to gain awareness.
NBA
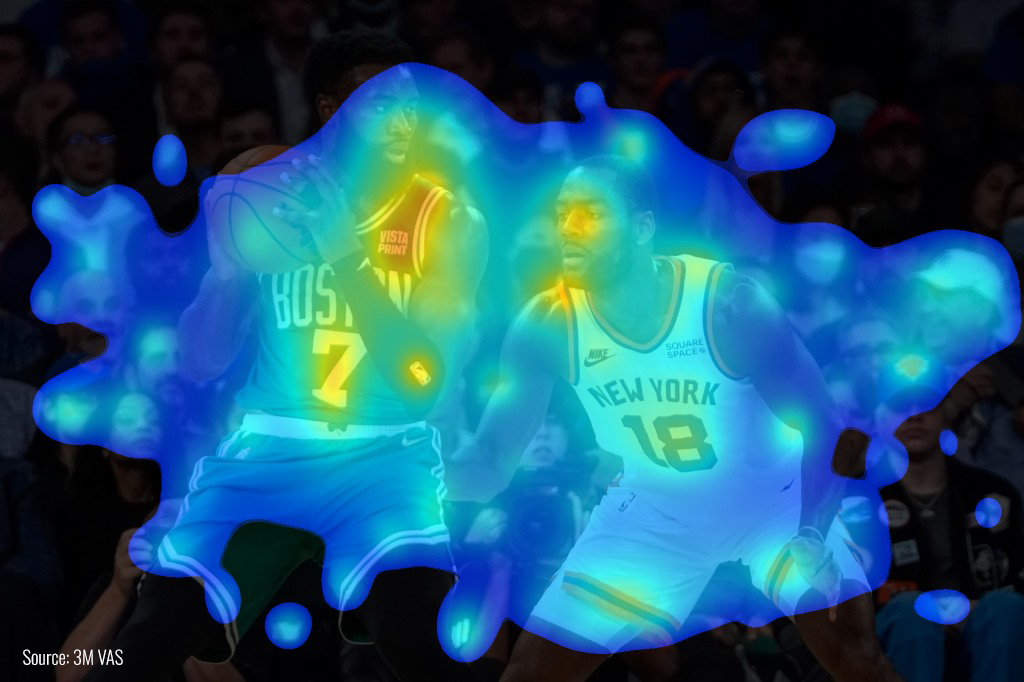
Lastly, we’ll take a look at a heatmap of a shot with NBA jersey patches. In this image, 3M VAS predicts a 73% isolated visibility for the Vistaprint patch and has that location as the first node in the audience gaze sequence. As mentioned previously, athletes’ faces tend to be hotspots for viewers and are usually one of the first places their eyes direct to. In this frame, the Celtics patch is in close proximity to both players’ faces and is therefore in prime position to be seen by the audience. While this is just one example, the location of the NBA patch is primed to be in similar positions during broadcast replays and close-up views of players.
Key Takeaways
Our analysis of patches in the NBA, NHL, and MLS all displayed positive results, but there are several important factors to consider when activating these patch partnerships.
Here are some of our tips to maximize value for sponsors:
- Optimize the Space: Even if this means abandoning a company’s primary logo, choosing an image that increases the probability it gets noticed is crucial. Some fonts may be difficult to distinguish in a condensed area, or shapes of some logos could decrease the visibility, so this decision should always be considered carefully.
- Consider the Contrast: In addition to the size, color contrast is a notable feature in 3M’s technology that contributes to the likelihood the patch is seen. Consider all company colors as well as secondary colors for the team when conjuring the final version of the patch.
- Utilize Social Media: While patches do receive several hours of exposure throughout the season, wide broadcast views don’t allow for much visibility and the speed of each sport can limit its prominence in some shots. However, on social media, teams have the ability to create graphics or choose images that reach millions and can put the jersey patch in a prime position to be seen. Navigate’s jersey patch valuations often display that over half of the value is derived from social media exposure. While plenty of this is organic, maximizing visibility on owned and operated channels can make a significant impact for a brand.
These jersey patch programs are still young, but have already proven to be a prime opportunity for brands from different industries and life cycles to increase their platforms in the U.S. and often internationally. Creative partnerships and activations should continue to increase the value and the demand for these patches, and create incredible opportunities for teams and brands.
If you have any questions on the topic, please email Drew@NVGT.com.
Appendix
3M™ Visual Attention Software (VAS) helps you iterate during the initial stages of your design. VAS predicts what viewers will see at first glance – with 92% accuracy – so you can quickly see what your audience sees. Avoid time consuming rework by using VAS to meet visual hierarchy goals before considering costly eye tracking studies.