Best Practices in Sports Business Benchmarking
![]()
In the world of sponsorship research, we often hear properties, brands and agencies using the term benchmarking as a way to compare sponsorship investments and relative value against “similar” sponsorships.
However, as frequent as this occurrence is, there is a warning to give when taking this approach to valuation and assuming that all sponsorships (e.g. NFL, MLB, NBA, etc.) are the same. Common anecdotes of CMO’s and SVP’s come to mind:
“…The competing brand down the street paid $X million dollars to be the title sponsor of that bowl game…”
or
“The guys across the country in a similar market got $X million per year for their naming rights deal…”
While this approach can give you a range of what deals have historically been sold for, it does not specifically tell you what you are receiving/offering. When assessing and pricing sponsorship opportunities, it is extremely important to understand all of the elements and assets being offered individually and what the sum of those parts equate to in dollars.
This needs to be done using a scientific and reliable methodology. Making an investment without first conducting this type of valuation analysis would be akin to stepping onto a car dealership and not kicking the tires, asking to see the CarFax, or asking to see what was under the hood.
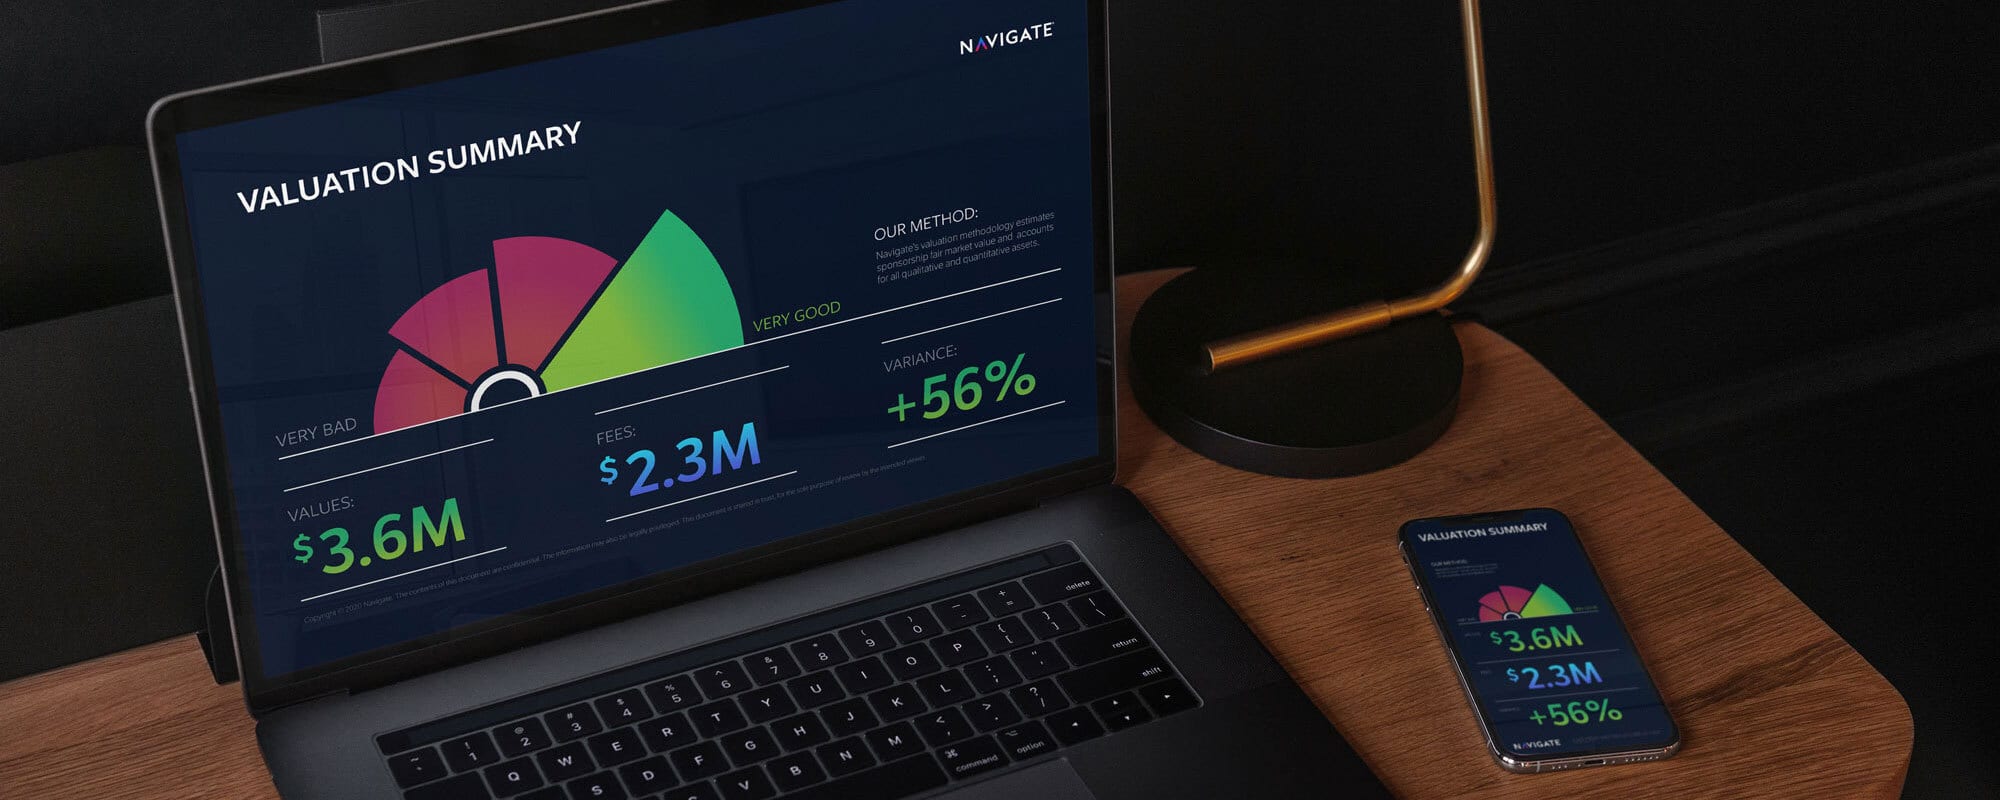
At Navigate, research-backed valuation along with historical benchmarking is a big part of the solutions we provide. In fact, it’s the reason why we’ve created the industry’s only decision support solution (The Sponsorship Navigator) that includes valuation capabilities, fan demographic info and directional data on sponsorship performance as well as best practices over the last 10 years.
This collection of industry leading analytics, tools and historical benchmarking allows us to set the fair market value for any given sponsorship in any industry within minutes. It also allows properties and brands to see how they are performing against historical sponsorship averages across metrics such as awareness, consideration, purchase intent, and more.
Using the Navigator, you can compare the success of sponsorships within Major League Baseball between insurance and banking categories on the west coast and on the east coast. This is only a small sample of what is available and the beauty is that these analyses can be conducted an unlimited amount of times.
In addition to market-to-market comparison, the Navigator also has a lot of other data resources and comparative capabilities uses:
Demographic Fit through Scarborough/Nielsen
- Through Scarborough data, The Sponsorship Navigator helps demonstrate how well a sponsor’s intended target aligns with the property’s audience.
Predictive Database:
- Combined insights from its custom sponsorship impact studies to provide users the ability to understand the potential impact of various sponsorships across leagues, markets, events, industries, and several other filters.
Buzz Factor:
- Uses real-time internet search data, to help users determine which sponsorships are associated with leagues, venues, teams or players that are receiving the highest lift in attention.
Looking at today’s sponsorship world, there are so many opportunities for brands and properties to determine great fits for successful partnerships. Navigate can make finding those winning partnerships much easier by applying methodological rigor and science in order to fit best practice research with historical data to reveal all kinds of insights.
Interesting in hearing more? Click here to contact Chris Todd.