Navigate’s Sweet 16 Projections – How Did We Do?

Welp, we picked quite the year to start projecting the Sweet 16, didn’t we?
For those unaware, this year’s NCAA men’s basketball tournament features the lowest average seed among those teams making the Sweet 16 since the tournament expanded to 64 teams 36 years ago. The average seed of the remaining teams is 5.88 compared to an average year of 4.45, making this year 32% crazier than normal.
This is also the first time in the history of the 64-team tournament that North Carolina, Duke, Kentucky and Kansas are all missing out on the Sweet 16. There are a lot of theories among college basketball experts and sports enthusiasts that this year’s perceived parity has been driven by the lack of “home court” advantage with very limited fans in attendance, as well as the toll the pandemic has taken on all the players and coaches.
Was COVID-19 the great equalizer in college basketball this year? Or, is there truly less parity than ever before?
Let’s dive into the data and find out!
Results
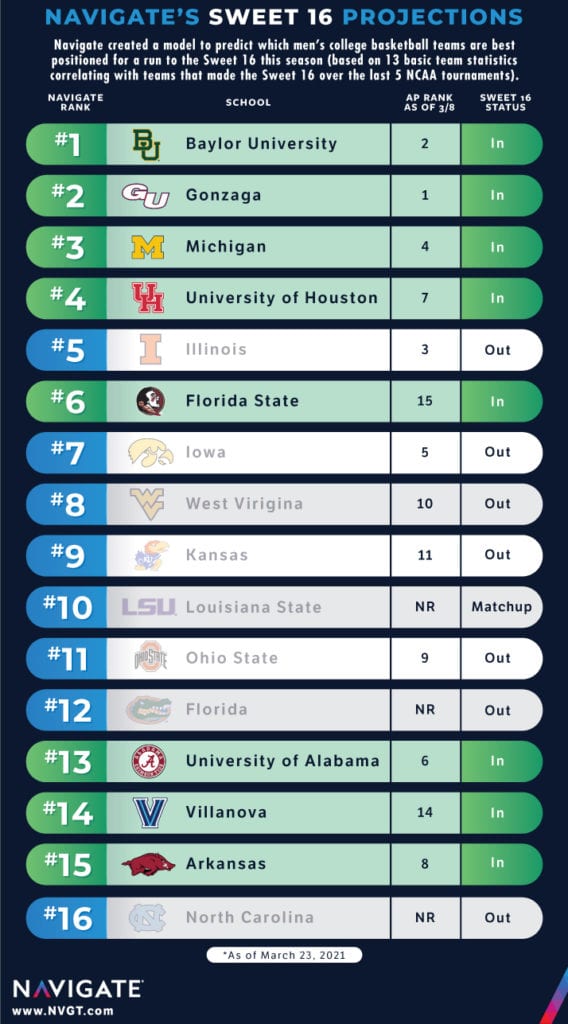
- Accuracy Better Than 50%. Out of the 16 teams selected by our model, only 15 of them had a chance to make the Sweet 16 given the scheduled matchups as Michigan played LSU in the Round of 32. Of the 15 possible teams, our model correctly predicted 8, or 53% of them.
- Correctly Uncovered Weaknesses. In the final AP rankings before the tournament began, Oklahoma State, Texas and Virginia were all ranked in the top 16 and theoretically were favorites to advance to the Sweet 16, but our model revealed that these 3 teams had weaknesses that would keep them out of the group, and the model was right about all 3 as Oklahoma State lost to Oregon State in the second round, Texas lost in the first round to Abilene Christian and Virginia lost in the first round to Ohio University.
- Dark Horses Underperformed. Before the tournament started, we found 3 teams not ranked in the final AP poll that fit the mold of Sweet 16 caliber teams in LSU, Florida and North Carolina. In the end, none of our 3 dark horses advanced to the Sweet 16, but while North Carolina lost in the first round both LSU and Florida advanced to the second round and were 1 win away from making a surprise run. So close!
Adjusted Modeling
- Strength of Schedule Impact. With so many non-Power 5 teams making the Sweet 16, including Loyola (IL), Oral Roberts and Creighton, one hypothesis is that Strength of Schedule was less of a factor this season. However, when removing this variable from our model, the results are even less accurate as only 6 of the Sweet 16 would have been correctly identified compared to 8 with the current model. Even when expanding to view to the top 30 teams best equipped to make the Sweet 16, the adjusted model finds 9 of the Sweet 16 while the current model finds 11. So, it appears Strength of Schedule was still a fairly strong determinant.
- Potentially Blending Models. Looking ahead to next season, a better approach to forecasting the Sweet 16 is likely relying on combining a few different models that include and exclude certain factors and maybe even expands the selection to find the first 16 teams that show up in each model. Stay tuned next season and hopefully we’ll shoot better than 53%!
Disclaimers
- Model only considers games played through 3/1, so we are not predicting outcomes of late-season games and or conference tournaments – but those should have only minimal impact on season-long team stats anyway
- The way these teams are seeded in the NCAA tournament will very likely make it impossible for us to get all 16 teams correct, but these are teams with underlying performance stats that align best with past Sweet 16 teams
- This model is brand new and has never been used to predict Sweet 16 teams before, but we plan to provide a POV on our performance when the real Sweet 16 teams emerge
- Stats used for projections are Strength of Schedule, Points per Game, Opponents Points per Game, Field Goal %, 3-Point %, Free Throw %, Offensive Rebounds per Game, Total Rebounds per Game, Assists per Game, Blocks per Game, Turnovers per Game and Personal Fouls per Game